How Finalyse can help
Combining a technological and practical approach to deliver actuarial and risk modelling solutions
Agile and comprehensive assessment, measurement and management of your market and liquidity risks
Helping you comply with the Solvency II regulations as well as optimising your Solvency II balance sheet
Liquidity Risk Management Planning Under the Solvency II Amendments: Key Actions for Compliance
Reviewed by Francis Furey, Principal Consultant
Introduction
The revised Solvency II Directive, adopted by the European Parliament in April 2024 and by the Council in November 2024, introduced strengthened rules for risk management, particularly regarding liquidity risk. The objective is to ensure that insurance and reinsurance undertakings can meet their financial obligations to policyholders, even in the event of a market stress. Under Article 144a, insurers and reinsurers (excluding small and non-complex undertakings) are now required to establish a Liquidity Risk Management Plan (LRMP), which includes cash flow projections that account for their assets and liabilities, along with liquidity risk indicators covering short, medium, and long-term horizons. This plan must be regularly submitted to the national regulator (in France, the ACPR) for enhanced supervision.
In this context, EIOPA, the European Insurance and Occupational Pensions Authority, has been mandated to develop Regulatory Technical Standards[1] (RTS) to ensure the uniform application of these new requirements across the European Union. As a key regulatory body, EIOPA plays a vital role in promoting financial stability and consistent risk management practices across member states. In October 2024, a public consultation was launched on these RTS, with a deadline for comments set for January 2, 2025. Based on a proportionate and principle-based approach, the final RTS will be incorporated into Solvency II Delegated Acts before 2026.
In this article, we first present the evolution of liquidity in France since 2020, before analyzing the nature and specifics of the RTS issued by EIOPA. In the second part, the article focuses on proposing relevant Liquidity indicators for life insurers over different horizons to be included in the LRMP, thereby enhancing the ability of insurers and reinsurers to effectively monitor their liquidity risk.
1. Trends in Liquidity Risk Evolution
Definition
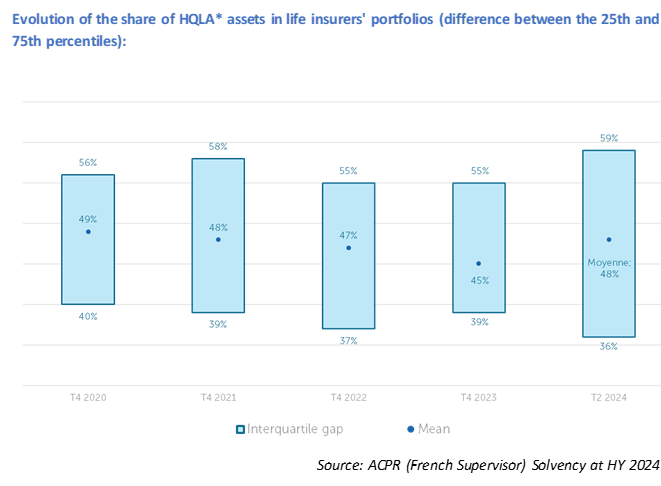
The proportion of High-Quality Liquidity Assets (HQLA) in insurers' portfolios remained stable between Q4 2020 and Q2 2024, reflecting a prudent investment strategy aimed at mitigating liquidity risk, particularly in the context of potential interest rate increases.

* To be able to be qualified HQLA, shares must be:
- quickly convertible to cash (Ex: Treasury Funds, 10-year French Bonds, shares listed on regulated markets)
- and must be a high credit quality, which implies a low probability of default (corporate and sovereign bonds rated A- or better).
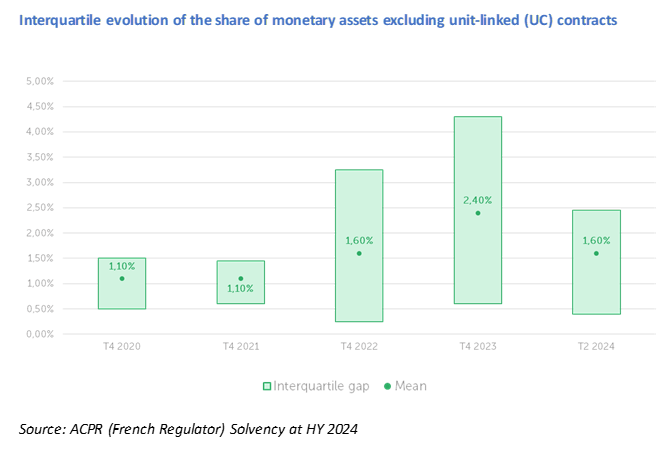
According to ACPR, insurers have, gradually increased their shares of monetary assets during 2022 and 2023.

Process mapping example
Cash assets of insurer rose significantly in 2022, peaking before declining by Q2 2024. (75th percentile dropping from 4.25% to 2.50%).
Summary of the Consultations Papers on the LRMP
To formalize liquidity risk management, the Solvency II revision requires companies to document liquidity analyses and indicators across various time horizons in a LRMP.
Rather than imposing uniform assumptions and models, EIOPA has defined principles that enable each undertaking to design an LRMP consistent with its internal assessment while ensuring uniform application across entities.
The table below summarizes the key points of the RTS issued by EIOPA regarding the content of the LRMP, covering both the quantitative and qualitative requirements currently under consultation:
Topics | Quantitative requirements | Qualitative requirements |
Criteria for covering liquidity analysis over the medium and long term |
| |
Time Horizon for Liquidity Analysis |
| |
Structure of the Liquidity Risk Management Plan and Updates |
| |
Overall assessment of liquidity risk | This section should include the following key elements:
| |
Assumptions underlyings the projections |
| Companies must provide qualitative information to explain and justify the assumptions used in their cash flow projections. Example: What assumptions should be retained to project future premiums, Lapse, or mortality? |
Buffer of liquid asset |
| Buffer assets must require qualitative information to demonstrate:
|
Cash-Flow Projected |
| Cash flow projections must be presented separately for portfolios with profit participation (e.g. euro savings, ) and unit-linked portfolios. This is not explicitly stated in the RTS, but it appears that cash flow projections should be performed in a real-world framework to best align with observed flows. Indeed, cash shortfalls measured in a risk-neutral framework do not reflect economic reality. |
Liquidity Risk Indicators |
| As the LRMP is principle-based, companies can adapt their indicators to their needs and profiles, but they must justify any deviation from the LCI if it is not implemented. |
Group-Level Liquidity Considerations |
| |
EIOPA requires companies to develop an LRMP with limited adjustments compared to current practices.
The differences from what is currently required under the Delegated Acts are summarised in the table below:
Current Requirements (Delegated Acts): | New Requirements for LRMP (RTS): |
|
|
Our opinion on the RTS: The requirements of EIOPA’s RTS aim to produce a detailed and accurate report on the company’s liquidity analyses, providing greater transparency regarding the insurer’s ability to maintain sufficient liquid assets to meet its obligations and to monitor this risk using indicators across various time horizons, particularly in times of stress. However, the RTS does not appear to require the inclusion, within the LRMP, of all the strategic investment, disinvestment, and management actions implemented by the company in response to a liquidity alert. The management actions (e.g., asset sales, use of REPO) prioritized under the 2024 EIOPA stress test reflect operational reality and highlight the central role these strategies play in liquidity risk management. Integrating these strategies into the LRMP would therefore provide a more comprehensive view and enhance the relevance and effectiveness of the report. |
For example, in the 2023 SFCR’s, some insurers mention several management actions implemented in case of a liquidity alert, which can be presented as follows:
Stress 1 | Stress 2 | |
Mass Lapse | Tension sur les spreads souverains | |
"Management Actions" and Disinvestments in Response to Stress | Rank the management actions employed in order of priority (1 = highest priority, 12 = lowest priority). | Rank the management actions employed in order of priority (1 = highest priority, 12 = lowest priority). |
Do not reinvest if net cash flows are positives. | 1 | 4 |
Use REPO | 2 | |
Reduce or suspend dividends. | ||
Reduce or suspend variable bonus. | 3 | |
Sell the most illiquid assets (direct real estate). | ||
Sell the most illiquid assets (real estate via SCIs). | ||
Sell the equity and debt funds | 3 | 2 |
Sell sovereign and corporate bonds with maturities over one year and rated BBB+ or lower. | 4 | 1 |
Do not reinvest asset cash flows (maturities, coupons, dividends, rents). | 5 | |
Adjust the strategic allocation towards a higher proportion of monetary assets. | 5 | |
Specify if other. | ||
Specify if other. |
| |
Specify if other. |
|
The FrenchInstitute of Actuaries has also compiled, in a liquidity risk guide, the management actions implemented by several major players to address liquidity risk.
Risk Liquidity Indicators regarding different horizons
Indicators recommended by EIOPA
EIOPA proposed several liquidity indicators based on stock and flow perspectives in a document published in January 2021[4], which it references in its RTS.
Firstly, EIOPA recommends in the RTS that companies produce the "Liquidity Coverage Indicator" (LCI), defined by the following formula for each time horizon under stress conditions:

- Liquidassetvalueafter haircuttheld in the buffer under stress conditions at time t.
- GrossprojectedCFDeficittat year t represents the gross difference between incoming and outgoing cash flows before transforming assets into liquidity (see 1.5).
The LCI is not calculated for projection years where the shortfall is negative or zero.
The following example illustrates the LCI ratio for the euro savings portfolio, applying a haircut ranging from 5% to 15% on the market value of buffer assets (e.g., A-rated bonds) in the event of a spread shock:
Portfolio with profit sharing à mid term | Bonds Market Value before Haircuts: (a) | Bonds Market Value after Haircuts: (b) | Math. Res. | Gross Incoming Flow ( c ) | Outgoing Flow: (d) | Shortfall: (d) - (c) if positive | LCI: (b)/( e) |
1 | 100 | 98 | 90 | 7 | 27 | 20 | 4,95 |
2 | 90 | 76 | 70 | 4 | 18 | 14 | 5,38 |
3 | 81 | 65 | 56 | 3 | 14 | 11 | 5,77 |
4 | 73 | 63 | 45 | 4 | 13 | 9 | 6,64 |
5 | 66 | 52 | 35 | 3 | 12 | 9 | 5,92 |
Agregated Indicator | 5,64 |
In this example, the indicator shows that over a medium-term horizon (5 years), a shock reducing the market value of buffer assets would still allow for covering approximately six times the cash flow deficit (shortfall) in the event of a sale.
Short – medium term risk monitoring
As part of the LRMP, several relevant indicators have been proposed by Finalyse for different time horizons.
The section dedicated to liquidity risk indicators in the LRMP should be segmented into three subsections for each time horizon:
- Short-term (up to 3 months): Address immediate obligations such as claims, margin calls, and operating expenses.
- Medium-term (3 to 12 months): Reflect expected policyholder behavior, macroeconomic changes, and asset maturities.
- Long-term (beyond 1 year): Cover evolving liabilities, strategic disinvestment plans, and liquidity risks that extend until they become immaterial.
In the short term, the insurer may define a minimum liquidity amount (e.g., cash or money market funds) to be held over a one-week or one-month period.
It can be established as an indicator:
- A relatively prudent quantile (>80%) based on a short-term benefits history (< 1 month).
- Monthly benefits multiplied by a prudent factor (e.g. 2).
To control liquidity risk, it is also interesting to put in place a medium-term indicator to ensure companies in the case of stressed scenarios (hikes in durable rates, spread tensions, Action Market down), it has enough liquid assets to pay the benefits.

Practical example
Where
- Short- to medium-term benefit payments (less than or equal to 1 year) are stressed and represent Lapses and other outflows (deaths, annuities, transfers) multiplied by a ratio to be defined by the entity.
- High-Quality Liquid Assets (HQLA) represent the high-quality liquid assets held by the entity. To comply with EIOPA's recommendations (see 2.6), the company could apply a haircut (or discount) by asset class to these assets.
It is also possible to establish a liquidity ratio in an environment where HQLA shares are stressed via market fluctuations (Change, spreads, rates, …).
The following example illustrates the liquidity ratio for each portfolio and on an overall basis.
Portofolio or Funds(M€) | HQLA Assets (a) | Stressed 1-year claims (b) | Liquidity Indicators (a)/(b) |
Fund or PTF 1 | 45 000 | 40 000 | 113% |
Fund or PTF 2 | 25 000 | 27 000 | 93% |
Fund or PTF 3 | 60 000 | 55 000 | 109% |
Fund or PTF 4 | 15 000 | 10 000 | 150% |
Total | 145 000 | 132 000 | 110% |
Figures expressed in millions of euros (€)
A ratio below 100% reflects a risk for the insurer of running out of liquidity in the event of a significant claims experience.
A prudent alert threshold can thus be set (Ex: <110%) leading the insurer to launch an action plan in line with its financial policy.
In medium term, the unrealized capital gains associated with the derivatives product, Caps, held in the asset portfolio also represent a hedging strategy against the lapse (therefore liquidity) and particularly mass lapse risks, in a situation of stress on the bond markets.
Indeed, insurers could conduct sensitivity analyses to determine to what extent these gains on the derivative product would offset bond losses in response to a mass lapse shock of 40%
In the following example, 19% of bond losses would need to be realized to meet policyholder obligations in the event of mass lapse following a 150-bps interest rate increase.
Portfolio on Saving € | CF Flow Rate Available (a) | Capital Losses on Bonds + 150bps (b) | Mass Lapse Risk | Unrealised gains Caps (d) | Cover ratio* (d)/(c) |
PTF 1 | 5% | 10 000 | 3 500 | 2500 | 71% |
PTF 2 | 2% | 6 000 | 2 280 | 2100 | 92% |
PTF 3 | 6% | 3 000 | 1 020 | 900 | 88% |
Total | 4% | 19 000 | 6 800 | 5 500 | 81% |
*The effect related to profit sharing is not considered in the proposed indicator.
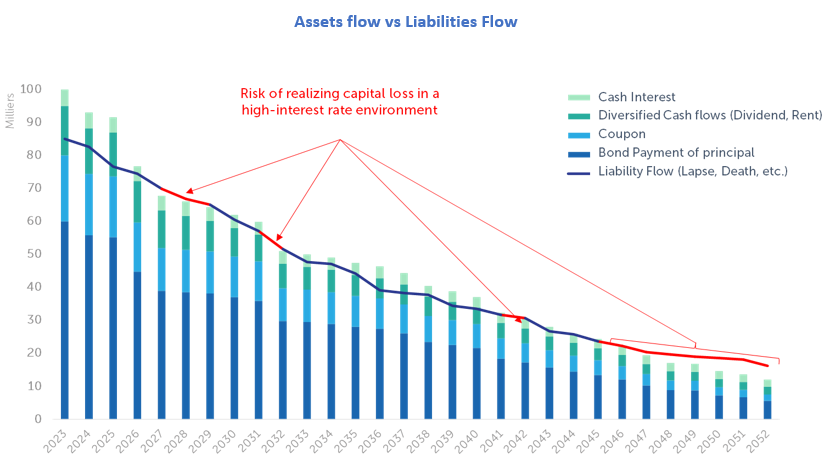
The cashflow gap is an essential indicator to master the liquidity risk on the long term, allowing the entity to ensure a correct matching, between active flows generated on the asset side and those on the liability side, year by year or in total. The formula is given to year k by:

The active flows mainly include:
- Reimbursements and bond coupons.
- Dividends and rents.
- Monetary interest.
And the liability flows represent the benefits to be paid, mainly deaths, lapse, arbitrages and contracts maturity.

A negative cash flow gap exposes the insurer to the risk of having to realize capital gains or losses to cover benefit payments, a risk that becomes more pronounced in the event of rising interest rates.
Conversely, a positive gap presents reinvestment risk, for instance, the need to reinvest at lower rates than those guaranteed by contracts in a declining interest rate environment.
The indicator therefore has a dual purpose, as it:
- Helps identify future periods where liquidity shortfalls may occur.
- Provides the company with better visibility on the bond maturities to prioritize in its investments.
Conclusion
Liquidity risk management is a cornerstone of the overall strategy for insurance and reinsurance companies. With the implementation of the mandated indicators representing the most significant gap between current and future requirements, companies must act now to align their processes and frameworks. Taking proactive steps today will not only reduce the additional workload when the amendment comes into effect in 2026 but also ensure a seamless transition while strengthening resilience against future liquidity crises.
Finalyse also invites you to learn more about the governance aspects and processes required for effective liquidity risk management in the related article.
How can Finalyse help?
In an ever-evolving landscape of liquidity risk management, Finalyse offers tailored support to insurance and reinsurance companies:
- We analyse your current process to identify potential gaps, ensure compliance with regulatory requirements, and provide a benchmark against market best practices.
- Our experts assist you in developing Liquidity Risk Management Plans, including relevant short-, medium-, and long-term liquidity indicators, along with cash flow projection analyses.
- We design stress tests to simulate extreme market scenarios, preparing you for potential liquidity crises.
- Finalyse implements effective governance structures and reporting mechanisms for continuous oversight.
- We offer training sessions to keep your teams informed about the latest developments and best practices.
- We assist you in setting up advanced tools for cash flow analysis and real-time monitoring.
Appendix
[1]https://www.eiopa.europa.eu/consultations/consultation-liquidity-risk-management-plans-solvency-ii-review_en
[2]www.iaisweb.org/uploads/2022/11/Level-2-document-Liquidity-Metrics-as-an-ancillary-indicator.pdf
[3] Tab « Flow » from Excel File « EIOPA-BoS-24-090_2024 Stress Test - Templates for the data collection - liquidity_v02.xlsx »
[4] https://www.eiopa.europa.eu/publications/methodological-principles-insurance-stress-testing-liquidity-component_en
Finalyse InsuranceFinalyse offers specialized consulting for insurance and pension sectors, focusing on risk management, actuarial modeling, and regulatory compliance. Their services include Solvency II support, IFRS 17 implementation, and climate risk assessments, ensuring robust frameworks and regulatory alignment for institutions. |

Our Insurance Services
Check out Finalyse Insurance services list that could help your business.
Our Insurance Leaders
Get to know the people behind our services, feel free to ask them any questions.
Client Cases
Read Finalyse client cases regarding our insurance service offer.
Insurance blog articles
Read Finalyse blog articles regarding our insurance service offer.
Trending Services
BMA Regulations
Designed to meet regulatory and strategic requirements of the Actuarial and Risk department
Solvency II
Designed to meet regulatory and strategic requirements of the Actuarial and Risk department.
Outsourced Function Services
Designed to provide cost-efficient and independent assurance to insurance and reinsurance undertakings
Finalyse BankingFinalyse leverages 35+ years of banking expertise to guide you through regulatory challenges with tailored risk solutions. |

Trending Services
AI Fairness Assessment
Designed to help your Risk Management (Validation/AI Team) department in complying with EU AI Act regulatory requirements
CRR3 Validation Toolkit
A tool for banks to validate the implementation of RWA calculations and be better prepared for CRR3 in 2025
FRTB
In 2025, FRTB will become the European norm for Pillar I market risk. Enhanced reporting requirements will also kick in at the start of the year. Are you on track?
Finalyse ValuationValuing complex products is both costly and demanding, requiring quality data, advanced models, and expert support. Finalyse Valuation Services are tailored to client needs, ensuring transparency and ongoing collaboration. Our experts analyse and reconcile counterparty prices to explain and document any differences. |

Trending Services
Independent valuation of OTC and structured products
Helping clients to reconcile price disputes
Value at Risk (VaR) Calculation Service
Save time reviewing the reports instead of producing them yourself
EMIR and SFTR Reporting Services
Helping institutions to cope with reporting-related requirements
Finalyse PublicationsDiscover Finalyse writings, written for you by our experienced consultants, read whitepapers, our RegBrief and blog articles to stay ahead of the trends in the Banking, Insurance and Managed Services world |

Blog
Finalyse’s take on risk-mitigation techniques and the regulatory requirements that they address
Regulatory Brief
A regularly updated catalogue of key financial policy changes, focusing on risk management, reporting, governance, accounting, and trading
Materials
Read Finalyse whitepapers and research materials on trending subjects
Latest Blog Articles
Contents of a Recovery Plan: What European Insurers Can Learn From the Irish Experience (Part 2 of 2)
Contents of a Recovery Plan: What European Insurers Can Learn From the Irish Experience (Part 1 of 2)
Rethinking 'Risk-Free': Managing the Hidden Risks in Long- and Short-Term Insurance Liabilities
About FinalyseOur aim is to support our clients incorporating changes and innovations in valuation, risk and compliance. We share the ambition to contribute to a sustainable and resilient financial system. Facing these extraordinary challenges is what drives us every day. |

Finalyse CareersUnlock your potential with Finalyse: as risk management pioneers with over 35 years of experience, we provide advisory services and empower clients in making informed decisions. Our mission is to support them in adapting to changes and innovations, contributing to a sustainable and resilient financial system. |

Our Team
Get to know our diverse and multicultural teams, committed to bring new ideas
Why Finalyse
We combine growing fintech expertise, ownership, and a passion for tailored solutions to make a real impact
Career Path
Discover our three business lines and the expert teams delivering smart, reliable support


