

Helping you comply with the regulations as well as optimising your Economic Balance Sheet (EBS)
Helping you comply with the Solvency II regulations as well as optimising your Solvency II balance sheet
Helping you comply with the regulations as well as optimising your ICS balance sheet

Divyank is a Senior Consultant with more than 8 years of experience and a part qualified Actuary. He has acquired expertise in Solvency II, IFRS17 and MCEV reporting and has worked for life and non-life business. He has extensive experience in Prophet modelling, DCS, statutory valuation and IFRS17 implementation and his coding skills include Prophet and DCS modelling, SAS, VBA, R.
Reviewed by Francis Furey, Principal Consultant.
The Bermuda Monetary Authority (BMA) introduced the Economic Balance Sheet (EBS) framework as a foundational element of its risk-based capital regime for insurers. This framework prioritises the economic valuation of assets and liabilities, aligning regulatory capital requirements with insurers' actual financial risks.
The BMA’s EBS framework closely aligns with Solvency II principles, enabling non-EU insurers to compete within the EU under similar regulatory conditions.
This alignment ensures Bermuda-based insurers meet international standards for capital adequacy and risk management, enhancing their ability to operate in EU markets. In 2024, the BMA also proposed several enhancements to the EBS regime as outlined in Consultation Paper II (CP2) to help maintain Solvency II equivalence. (read Finalyse article on Solvency II amendments for more details).
This blog post explores the key distinctions between the Bermuda Monetary Authority's (BMA) Economic Balance Sheet (EBS) framework and the Solvency II regime, with a particular focus on their application to life insurers. It delves into critical areas such as Technical Provisions (TP) and Basic Solvency Capital Requirements (BSCR), highlighting how these frameworks address regulatory capital requirements, risk management, and valuation approaches in different ways.
Matching Adjustment and Scenario-based approach
Insurance products characterised by long-term, predictable liabilities and illiquid cash flows are backed by assets designed to closely match these cash flows and be held until maturity. Both the BMA’s Scenario-Based Approach (SBA) and Solvency II’s Matching Adjustment (MA) enable insurers to apply higher discount rates, reflecting asset yields net of credit risk, though their methodologies differ.
It should be noted that Spanish life insurers remain the only EU players to use MA when considering the UK out of the EU. The changes to the volatility adjustment (VA) as part of the Solvency II amendments are aimed to bring it closer to the MA.
Solvency II’s MA permits a discount rate over the risk-free curve, reducing liability values. In contrast, SBA evaluates liabilities across various economic scenarios, setting the liability as the maximum asset value needed to cover liabilities in all, ensuring adequate capital.
Both approaches enhance surplus and capital position, but the MA limits spreads reflected in the discount rate, excluding the higher of default and downgrade costs and capping the spread at 75% of the long-term average.
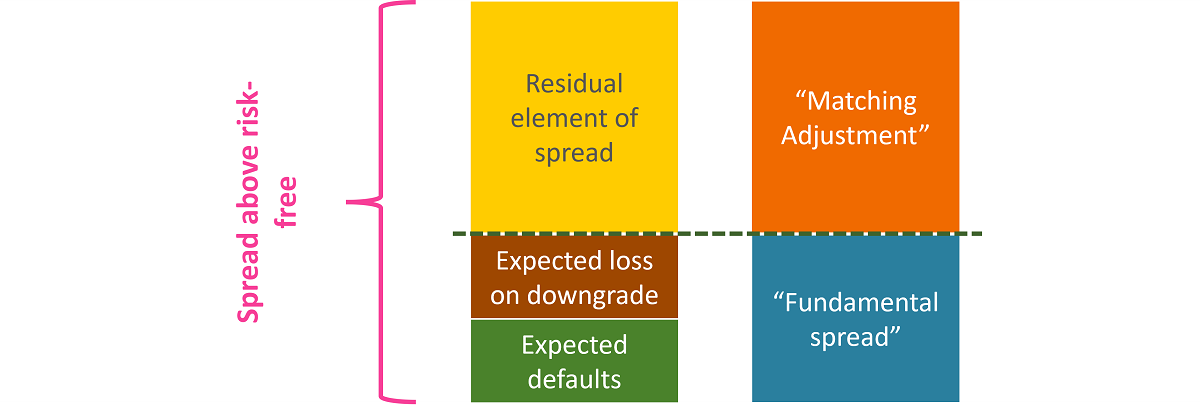
Source of image: https://actuaries.org.uk/media/o0fdavrl/ifoa-ma-wp-fundamental-spread-research-july-2022.pdf
Initially, SBA discount rate had no fundamental spread (FS), allowing full benefit from the illiquidity premium, with FS averaging 50bps. However, CP2 developments now require adjustments for default and downgrade (D&D) costs, narrowing the gap between the MA and SBA discount rates.
SBA eligibility limits
The Solvency II Directive[1] mandates that assets eligible for MA are:
The recent Solvency II review has led to scrutiny of strict investment guidelines, with the PRA aiming to expand eligible assets for MA. This change will increase investment flexibility for UK insurers, allowing for long-term investments like property-backed assets, infrastructure, and education loans.
The BMA categorizes assets allowing to back liabilities for SBA as:
Assets may include those rated below IG, as well as commercial real estate and residential mortgages.
Investment strategy differences
Differences in asset eligibility and investment criteria result in divergent investment strategies. SBA’s less restrictive criteria enable insurers to explore opportunities beyond traditional fixed-income markets to achieve higher yields — a critical advantage, particularly in a prolonged low-interest-rate environment.
Increased allocations to private credit and other lower credit quality bonds have been observed in the Bermudan market to maximize discount rates under SBA, which would not be permitted in MA asset portfolios.
Risk margin
While both the BMA’s EBS framework and Solvency II (under the standard formula) use the cost-of-capital method to calculate the risk margin, they differ in focus and scope. These differences are expected to grow following Solvency II’s adoption of an updated risk margin calculation based on the 2020 review.
| Aspect | Solvency II | BMA's EBS |
|---|---|---|
| Scope | Focuses on non-hedgeable risks, typically includes underwriting, operational and other(s) | Slightly broader scope that includes credit risk in addition to insurance and operational risks |
Diversification | Does not allow diversification across | Explicitly allows it, potentially reducing the risk margin. This will be changed following CP2 implementation |
| Calculation level | Single risk margin for the entire business (no mandatory requirement to separate general business and long-term business) | Separate calculations for general and long-term business to account for different risk profiles |
Following the 2020 Solvency II review, the cost-of-capital rate will reduce from 6% to 4.75%, and a time-dependent parameter will be introduced in the risk margin calculation (read Finalyse article on Solvency II amendments). These changes will affect the risk margin under Solvency II.
Market risk
Under the BMA’s EBS framework, flexibility is a defining feature. For instance, the calculation of interest rate risk incorporates diversification adjustments, enabling insurers to reflect asset-liability management strategies in their capital requirements and under Solvency II fixed shocks (upward and downward) are applied across the entire yield curve without additional adjustments.

Under EBS framework, fixed income risk incorporates capital charge factors specific to the credit quality and type of the instrument, allowing for diversification adjustments across asset classes (within the sub-risk). Solvency II's spread risk applies predefined shocks to the credit spreads of bonds and loans, calibrated based on their credit ratings and durations.
The equity risk is assessed using broad asset classes under EBS framework with no allowance for customised capital factors based on asset types. Under the Solvency II, equity risk categorizes assets into Type 1 (developed markets) and Type 2 (emerging markets), assigning predefined capital charges with symmetric adjustments to reduce cyclicality.
The currency risk adopts a uniform 25% shock under both the regimes, while it permits partial offsets for hedging programs, provided stringent criteria are met. This bespoke approach accommodates the diverse exposures of Bermuda-based insurers.
Insurance or life underwriting risk
Risks affecting liability cashflows are referred to as long-term insurance risks under BMA’s EBS framework. This is analogous to the life underwriting risks under Solvency II.

The calculation approach for each sub-risk capital differs between the two modules. Under the BMA’s EBS framework, the insurance products are categorized into the sub-risks like, mortality, morbidity/disability, longevity, stop loss, riders or variable annuity guarantee products).
Capital charges for insurance risks are calculated using varying factors based on product type. For mortality, longevity, and variable annuity guarantees, factors are applied to net amount at risk or adjusted reserves and guarantees. For morbidity risks, factors are applied to both net amount at risk and premiums for critical illness and health insurance. Stop loss products and riders use a factor based on net annual premiums, while other insurance risks consider policyholder behaviour, lapses, expenses, and guarantees. Separate calculations for lapse and expense risks will come into effect post-CP2 implementation.
Under Solvency II, shock-based calculations involve determining the best estimate of liability under stressed scenarios for each sub-risk, applying shocks to relevant parameters.
Notably, the catastrophe sub-risk within the insurance (or life underwriting risk) module is part of the underwriting risks under Solvency II while it is classed as sub-risk under the P&C risk module within BMA’s EBS framework.
Operational risk
Operational risk capital under EBS is calculated using a straightforward factor-based approach, with no reliance on premiums or provisions. It is determined as a percentage of the BSCR, using a correlation matrix.
Operational risk charge = ρ * ACov
Where ρ is determined by the BMA based on an overall score (higher scores result in lower ρ). The score is calculated from six factors, including governance, risk management, and measurement processes, with points awarded based on implementation and adherence to BMA standards.
Under Solvency II - Operational risk charge is calculated as the sum of two components:
SCR Operational = min (30% × BSCR; Op) + 25% * Expense UL
where Op represents premiums and technical provisions, and Expense UL is for policies with policyholder-borne investment risk.
Diversification
Life insurance risks under Solvency II and BMAs EBS framework - Under Solvency II, diversification capitalises on correlations like mortality and longevity (-0.25), optimising capital, with low catastrophe risk correlations enhancing the effect, whereas BMA’s EBS framework focuses on categories like stop-loss and rider risks with stronger positive correlations (e.g., 0.75) and more conservative negative correlations (-0.5 for longevity and mortality).
However, independent modelling of risks like variable annuities limits diversification. Solvency II offers broader diversification, while EBS is more granular but conservative.
Market risks under Solvency II and BMAs EBS framework - Solvency II offers precise diversification with detailed correlations (e.g., 0.5 for interest rate and equity, 0.25 for foreign exchange), optimising risk alignment, whereas BMA’s EBS framework simplifies risk grouping, potentially understating diversification benefits. While Solvency II’s granularity supports tailored strategies, BMA prioritises simplicity, which may miss optimization opportunities.
Basic Solvency Capital Requirement - Solvency II segments risks into five modules (market, default, life, health, and non-life), using a uniform correlation structure (typically 0.25), with exceptions like 0.5 between default and non-life. In contrast, BMA’s EBS framework has four modules (Market, Credit, P&C, and Life) with a broader correlation range (0 to 0.5). BMA assumes zero correlation between Life and P&C, while Solvency II applies 0.25. BMA also has a stronger 0.5 correlation between Credit and P&C, offering sharper diversification insights.
In summary, while both the Matching Adjustment (MA) and Scenario-Based Approach (SBA) enhance insurers’ capital and surplus, they differ in execution and adaptability. The MA imposes stricter constraints on asset eligibility and discount rates, whereas the SBA offers greater flexibility, supporting higher yields and adaptability to changing economic conditions.
The differences in the market and life risk module reflect the BMA's focus on flexibility and tailored assessments versus Solvency II's emphasis on standardization and uniformity, demonstrating the varied regulatory philosophies in addressing market risk globally.
In addition to this, the differences in diversification and operational risk module highlight Solvency II’s precision versus BMA’s simplicity and practicality.
In the dynamic and evolving landscape of the BMA’s Economic Balance Sheet (EBS) framework, Finalyse offers comprehensive support to insurance and reinsurance companies. Our expertise ensures seamless alignment with regulatory standards and enhances operational efficiency. Here’s how we can help:
Contact us today to transform your approach to actuarial reporting & modelling and stay ahead in the rapidly evolving insurance landscape.
[1] Art. 77b - Directive 2009/138/EC
[2]Including government, municipal and corporate bonds, securitisations, commercial mortgage loans, CLOs, preferred stock, certificates of deposit and other debt instruments
[3] This is not a target, but a conservative limit, as specified in the Long-term Group Instructions Handbook.
Finalyse InsuranceFinalyse offers specialized consulting for insurance and pension sectors, focusing on risk management, actuarial modeling, and regulatory compliance. Their services include Solvency II support, IFRS 17 implementation, and climate risk assessments, ensuring robust frameworks and regulatory alignment for institutions. |

Check out Finalyse Insurance services list that could help your business.
Get to know the people behind our services, feel free to ask them any questions.
Read Finalyse client cases regarding our insurance service offer.
Read Finalyse blog articles regarding our insurance service offer.
Designed to meet regulatory and strategic requirements of the Actuarial and Risk department
Designed to meet regulatory and strategic requirements of the Actuarial and Risk department.
Designed to provide cost-efficient and independent assurance to insurance and reinsurance undertakings
Finalyse BankingFinalyse leverages 35+ years of banking expertise to guide you through regulatory challenges with tailored risk solutions. |

Designed to help your Risk Management (Validation/AI Team) department in complying with EU AI Act regulatory requirements
A tool for banks to validate the implementation of RWA calculations and be better prepared for CRR3 in 2025
In 2025, FRTB will become the European norm for Pillar I market risk. Enhanced reporting requirements will also kick in at the start of the year. Are you on track?
Finalyse ValuationValuing complex products is both costly and demanding, requiring quality data, advanced models, and expert support. Finalyse Valuation Services are tailored to client needs, ensuring transparency and ongoing collaboration. Our experts analyse and reconcile counterparty prices to explain and document any differences. |

Helping clients to reconcile price disputes
Save time reviewing the reports instead of producing them yourself
Helping institutions to cope with reporting-related requirements
Be confident about your derivative values with holistic market data at hand
Finalyse PublicationsDiscover Finalyse writings, written for you by our experienced consultants, read whitepapers, our RegBrief and blog articles to stay ahead of the trends in the Banking, Insurance and Managed Services world |

Finalyse’s take on risk-mitigation techniques and the regulatory requirements that they address
A regularly updated catalogue of key financial policy changes, focusing on risk management, reporting, governance, accounting, and trading
Read Finalyse whitepapers and research materials on trending subjects
About FinalyseOur aim is to support our clients incorporating changes and innovations in valuation, risk and compliance. We share the ambition to contribute to a sustainable and resilient financial system. Facing these extraordinary challenges is what drives us every day. |

Finalyse CareersUnlock your potential with Finalyse: as risk management pioneers with over 35 years of experience, we provide advisory services and empower clients in making informed decisions. Our mission is to support them in adapting to changes and innovations, contributing to a sustainable and resilient financial system. |

Get to know our diverse and multicultural teams, committed to bring new ideas
We combine growing fintech expertise, ownership, and a passion for tailored solutions to make a real impact
Discover our three business lines and the expert teams delivering smart, reliable support